Table of Links
Abstract/Zusammenfassung
Publications
Acknowledgements
CHAPTER 1: INTRODUCTION
-
Introduction
1.1 Overview of thesis contributions
1.2 Thesis outline
CHAPTER 2: BACKGROUND
2.1 Blockchains & smart contracts
2.2 Transaction prioritization norms
2.3 Transaction prioritization and contention transparency
2.4 Decentralized governance
2.5 Blockchain Scalability with Layer 2.0 Solutions
CHAPTER 3. TRANSACTION PRIORITIZATION NORMS
-
Transaction Prioritization Norms
3.1 Methodology
3.2 Analyzing norm adherence
3.3 Investigating norm violations
3.4 Dark-fee transactions
3.5 Concluding remarks
CHAPTER 4. TRANSACTION PRIORITIZATION AND CONTENTION TRANSPARENCY
-
Transaction Prioritization and Contention Transparency
4.1 Methodology
4.2 On contention transparency
4.3 On prioritization transparency
4.4 Concluding remarks
CHAPTER 5. DECENTRALIZED GOVERNANCE
-
Decentralized Governance
5.1 Methodology
5.2 Attacks on governance
5.3 Compound’s governance
5.4 Concluding remarks
CHAPTER 6. RELATED WORK
6.1 Transaction prioritization norms
6.2 Transaction prioritization and contention transparency
6.3 Decentralized governance
CHAPTER 7. DISCUSSION, LIMITATIONS & FUTURE WORK
7.1 Transaction ordering
7.2 Transaction transparency
7.3 Voting power distribution to amend smart contracts
Conclusion
Appendices
APPENDIX A: Additional Analysis of Transactions Prioritization Norms
APPENDIX B: Additional analysis of transactions prioritization and contention transparency
APPENDIX C: Additional Analysis of Distribution of Voting Power
Bibliography
4.3 On prioritization transparency
In this section, we delve into our analysis of prioritization transparency within the Ethereum and Bitcoin blockchains. We show that the current assumptions about transparency in blockchains do not hold in practice. Then, we show that transaction relay networks are becoming more popular in Ethereum, with miners creating their own transaction relay networks for private transactions. We also show that miners have different measures for utility of mining a transaction than just the offered fee rate or gas price of a transaction. For instance, transactions issuers that pay miners via a direct transfer to their wallet address or through off-chain fee receive a higher prioritization than their corresponding transaction fee rates would suggest.


4.3.1 Prevalence of transaction bundling
In this section, we use the Flashbots data set outlined in §4.1, which has 6,937,292 transactions (2% of all issued transactions in Ethereum) contained in 3,284,886 bundles from Flashbots. These bundles constitute transactions privately sent to miners. For instance, among all blocks in the data set E, 972,911 (52.11%) of blocks have at least one such Flashbots transaction: Private transactions are becoming quite common across most of the powerful mining pools in Ethereum.
Flashbots bundles are quite prevalent in Ethereum, representing 99.99% of the total Ethereum hash rate (refer §4.2.2). Our analysis shows that each Flashbots bundle contains at least 1 transaction and at most 631 transactions; on average they contain 2.11 transactions, with a median of 1 and a std. of 6.47. We noticed that Ethermine alone included more than a quarter (26.63%) of all 3,284,886 bundles (refer Figure 4.2). Also, blocks contain at most 40 bundles, with an average of 3.38, a median of 3, and a std. of 2.64 bundles.
Miner Incentives in Incorporating Flashbots Bundles
Flashbots allows users to bundle together a set of transactions, thereby specifying the order in which they are executed. The bundles can also include public transactions, propagated over the public P2P network. A public transaction that buys a coin on a Decentralized Exchange (DEX) can, for example, lead to an arbitrage opportunity (Qin et al., 2021). A user can include this transaction in a bundle along with one of their own to capture this arbitrage opportunity. The last transaction in the bundle usually pays the miner (based on the profit made) in Ether[13] via a direct transfer (i.e., coinbase transfer) to their wallet addresses (Flashbots, 2022c). This essentially means that miners are being offered different prices for mining the same transaction. In other words, miners have a financial incentive for including transactions that are in a bundle at the top of a block, even though the public fee offered through gas price in the transaction data is very low (refer Figure 4.3). Hence, each transaction in the bundle has a normal gas price and a bundle gas price, which is calculated using the total gas used by all transactions in the bundle and the total miner reward for mining the bundle.


Bundling public transactions
To identify bundles with transactions that were probably sent through the public P2P network, we rely on a simple heuristic. Specifically, we focus on transaction bundles of size 2 and 3, and search for transactions that have likely resulted in a publicly sent transaction being bundled. Then, we find bundles issued from different issuers that include a zero and non-zero max-priority fee[14] transactions. The intuition is that miners have no incentive to include transactions that offer a zero max-priority fee, as they receive no rewards for mining these transactions. Unless they receive extra payment (through Flashbots coinbase transfer). Hence, transactions that have a non-zero max-priority fee were likely sent publicly.
For transaction bundles of size 2, we look for transactions whose issuers are not the same. Furthermore, we look for cases where the first transaction offers a non-zero max-priority fee, with no coinbase transfer to the miner, and the second transaction offers a 0 max-priority fee and a non-zero coinbase transfer to the miner.
For transaction bundles of size 3, we look for signs of sandwich attacks (Qin et al., 2022). We look for bundles where the first and last transactions have the same issuer, but the second transaction has a different issuer. Additionally, we check that the first and third transactions offer a 0 max-priority fee, meaning that the miner receives no reward from the gas price for mining these transactions. Then, we ensure that the second transaction offers miners a non-zero max-priority fee, while the third offers miners a fee through direct coinbase transfer. This scenario might be a classic sandwich attack, where public transactions are bundled between two private transactions, sent by the same issuer, and the miner gets paid via a coinbase transfer from the third transaction (Qin et al., 2022).
We found 853,394 transactions in 426,697 bundles of length 2, and 1,231,695 transactions in 410,565 bundles of length 3. From those, we found that 110,401 (25.87%) and 37,447 (9.12%) bundles, of lengths 2 and 3, respectively, fit our heuristic. We then calculate the actual max-priority fee for these bundles, as the total gas used by all transactions in the bundle divided by the total miner reward (from gas usage and coinbase transfer). Figure 4.3 shows the price difference miners get for including publicly and bundled transactions. Note that around 40% of transactions differ in the actual max-priority fee by 100 gwei-per-units-of-gas. Flashbots bundles offers much higher gas prices in comparison to the public announced max-priority fee alone.
Towards liquidations through bundling
Lending protocols rely on over-collateralization of assets: In order to borrow assets from these protocols, a user has to deposit a collateral of at least 150% of the borrowed amount. To borrow 1 USDC on AAVE, for example, a user would have to collateralize at least 1.5 USDC worth of another asset (e.g., in ETH or BTC). If the ratio of the collateral asset versus the borrowed asset falls below 1.5, the user’s position can be liquidated by any other participant until the ratio stabilizes to 1.5 again. The liquidator then pays back a portion of the user’s debt to receive the collateral asset at a discount. In order to assess an asset’s on-chain value, lending protocols rely on oracle services, e.g., Chainlink Data Feeds (Breidenbach et al., 2021; Chainlink, 2022). In the case of the two largest lending


platforms, AAVE V2 (AAVE, 2022) and Compound (Compound, 2022), for instance, Chainlink provides the price of each asset in ETH and USD, respectively.
We found 16,418 liquidations in AAVE and 6387 liquidations in Compound. Out of these, there were 4863 AAVE liquidations and 2036 Compound liquidations that were sent privately through Flashbots. In AAVE, the three largest collateral assets that were liquidated were WETH (57.58%), LINK (11.84%), and WBTC (8.99%). The debt assets paid for, i.e., the assets borrowed by the users, were USDC (33.77%), USDT (22.27%), DAI (19.39%), and GUSD (5.12%), all of which are stablecoins and account for over 80% of the assets repaid by liquidators. In Compound, the three largest collateral assets that were liquidated were WETH (69.7%), WBTC (10.31%), and UNI (5.5%). The debt assets were USDC (38.9%), DAI (30.45%), USDT (23.38%), and TUSD (2.7%), all of which are stablecoins and account for over 90% of the assets repaid by liquidators.
Liquidation with bundled oracle updates
To check the adverse effect of bundling oracle updates, we looked at bundles with Chainlink (Chainlink, 2022) oracle updates as they are a key part of liquidations. We identified 1165 AAVE liquidations distributed within 1154 bundles (2662 transactions including 1301 oracle updates) that contained at least one oracle update. In Compound, we found 648 liquidations distributed within 641 bundles (1457 transactions including 751 oracle updates) that contained oracle updates. In AAVE, out of 1154 bundles, there were 994 (86.14%) bundles that contained an oracle update followed by a liquidation, and 52 (4.51%) with two oracle updates followed by liquidations. In Compound, out of 641 bundles, there were 548 (85.49%) bundles that contained an oracle update followed by a liquidation, and 39 (6.08%) with two oracle updates followed by liquidations. For details on the specific liquidations for both AAVE and Compound, please refer §B.2 in


the appendix. Out of the total 1813 liquidations in AAVE and Compound we found that only 24 were possible in the previous block. Almost 98.68% of such liquidations were, hence, only possible because of the Chainlink updates in that block.
In order to calculate the profit made by the liquidators, we get the amount of debt that was repaid and the amount of the underlying collateral that was received by the liquidator. We calculate the price of each token at the time of liquidation by looking at the on-chain oracle price from Chainlink at the same block number, where the liquidation took place. For AAVE and Compound, we specifically use the Chainlink on-chain price used by AAVE and Compound in their respective protocols. AAVE uses the price in ETH as a reference for its tokens, whereas Compound’s price oracles are denominated in USD. For AAVE, in order to calculate the profit made by each liquidation, we calculate the profit in ETH, and then multiply the profit by the current Chainlink on-chain price of ETH in USD. Per Figure 4.4, liquidations that are bundled with a Chainlink update also have larger profits for liquidators, which implies that the lucrative liquidations are more likely to be bundled together with a Chainlink update.
Characterizing transaction bundling
To investigate which DEXes protocols are called within Flashbots bundles, we focus on the following contract calls: 0x Protocol (0x Protocol, 2022), Balancer (Balancerl, 2022), Bancor (Bancor, 2022), Curve (Curve, 2022), SushiSwap (SushiSwap, 2022), and Uniswap V1 and V3 (Uniswap, 2022). In our set of 3,284,886 Flashbots bundles, we find that 2,231,051 (67.92%) unique Flashbots bundles (and 3,076,760 transactions) called at least one of these contracts. Table 4.2 shows the distribution of the number of transactions and the number of bundles for each of these contracts. We see that Uniswap and SushiSwap are the most bundled DEXes protocols in Flashbots.
4.3.2 Side channel (dark-fee) payments and transaction acceleration
In this section, we focus on the Bitcoin blockchain, with a particular emphasis on the data set D. Our goal is to build upon our earlier discussion in §3.4 regarding dark fees transactions.
Prevalence of transaction acceleration
As previously discussed in §3.4, dark-fee transactions (or accelerated transactions) are transactions that offer additional fees to specific mining pools via an opaque and nonpublic side-channel payment. In Bitcoin, the top 5 mining pools named BTC.com (BTC.com, 2022), AntPool (AntPool, 2022), ViaBTC (ViaBTC, 2022), F2Pool (F2Pool, 2022), and Poolin (Poolin, 2022), deploy transaction acceleration services, which enables users to “accelerate” the confirmation of their transactions by offering mining pools dark-fees.
These (dark-)fees are paid in fiat currency through a direct bank transfer or via other crypto coins to the mining pool. They are, therefore, opaque or dark to other participants. Strangely enough, these fees are also non-refundable as the miner receives them regardless of whether they include the transaction in a block or not—a guaranteed payment. The fees paid by the transaction issuer are, furthermore, not made public: only the user and the miner knows the actual fee paid by the transaction inclusion. Since transaction issuers pay the fees off-chain, miners have an incentive for prioritizing these transactions despite the low fee rate offered on-chain. It also implies that the transaction issuer offers a miner a different fee compared to that offered to other miners for including their transaction in a block. Miners do not disclose such private fees paid by issuers. This behavior is different from that of Flashbots in Ethereum: The latter discloses the final dark-fee after the transaction is committed (see §4.3.1).
Characterizing transaction acceleration
In order to detect accelerated transactions, we proposed two metrics called signed position prediction error (SPPE) and position prediction error (PPE) that are described in §3.2.2.
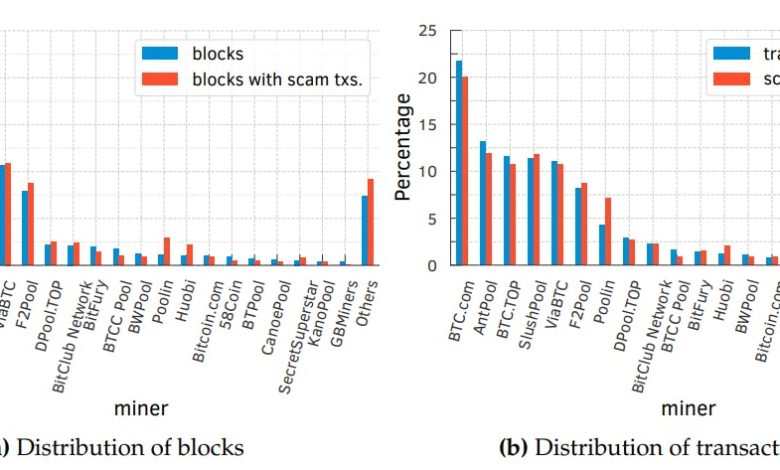
To estimate the prevalence of accelerated transactions in blocks mined by different mining pools, we compute the fraction of blocks mined by the top-15 mining pools, based on their hash rates in our 3-year data set D (refer to §B.3 and Figure 4.1a), that contained transactions with SPPE ≥ 99%. Per Figure 4.5, we find that many large mining pools such as BTC.com, F2Pool, and ViaBTC are likely including accelerated transactions in a sizeable fraction of their mined blocks, with ViaBTC including it in over 40% of their blocks.


If we consider all mining pools’ transactions with an SPPE ≥ 50% (1,869,043 transactions, in total), from 2018 to 2020, users transferred in total 11,631,217 BTC (or ≈ 223.55 billion USD[15]). The accelerated transactions accounted for 240,226 BTC (or ≈ 4.62 billion USD), corresponding to approximately 2.07%.
Aggregated power of colluding miners
In order to check the impact of transactions acceleration services on commit time of transaction, we ran active real-world experiments. Specifically, we paid ViaBTC (ViaBTC, 2022) to accelerate selected transactions (see Table B.2 in §B.4) during periods of high congestion between November 26th and December 1st, 2020. From 10 Mempool snapshots during this period, we selected transactions that offered a very low fee rate (i.e., 1–2 sat-per-byte) for acceleration. To keep our acceleration costs low, we selected transactions with the smallest size (which was 110 bytes) within this set. For each of the 10 snapshots, we had multiple transactions with such low fee rates and small size, for a total of 212 transactions across all the snapshots. We randomly selected one transaction from each snapshot (i.e., 10 transactions) and paid ViaBTC 205 EUR to accelerate them.
We then compare the priority with which the accelerated transactions and the 202 (= 212 − 10) non-accelerated transactions with similar fee rates and sizes were included in the Bitcoin blockchain. The impact of acceleration was strikingly apparent as shown


in Table 4.3. All 10 accelerated transactions were included within 1–3 blocks after their acceleration, with an average delay of 1.8 blocks. In contrast, the minimum delay for the 202 non-accelerated transactions of comparable fee rates and sizes was 9 blocks, with an average delay of 198.5 blocks. Interestingly, 38 of the non-accelerated transactions were yet to be included in the blockchain by December 4th, 2020. Similarly, the accelerated transactions were included in top 0.07–4.39 percentile positions, with an average 0.79 percentile position, while the non-accelerated transactions were included in the beyond top 17.47–99.95 percentile positions, with an average 84.46 percentile position. From the above observations, it is clear that the transactions we accelerated were included with high priority, meaning Bitcoin mining pools take off-chain fees into account when prioritizing transactions.
Although, we accelerated our transactions using ViaBTC mining pool, our 10 transactions were included by 5 different mining pools, namely F2Pool, AntPool, Binance, Huobi, and ViaBTC. As we accelerated transaction during time of high congestion in Bitcoin, no mining pool would have included a transaction offering 1–2 sat-per-byte, unless they were accelerated. Since we only paid the ViaBTC mining pool, this implies that ViaBTC is colluding with other mining pools to accelerate transactions that offer off-chain fees. Except for Binance, all these colluding pools rank amongst the top-8 mining pools in terms of their hash rates at the time of our experiments. Table 4.4 shows the individual as well as the combined hash rates of these 5 colluding mining pools over the last day, last week, and last month before the conclusion of our experiment on December 1 st , 2020. The most striking and the most worrisome fact is that the combined hash rates of these colluding mining pools exceeds 55% of the total Bitcoin hash rate. For more details, refer to Figures B.3 and B.4 in §B.4 in the appendix. Additionally, if


mining pools are colluding to include accelerated transactions, then they might also potentially collude in malicious ways.
Furthermore, due to the lack of transparency into their queue, miners can charge higher prices for their acceleration services when colluding. It means that they can overcharge the transaction issuers for including their transactions.
In this section, we present the findings derived from our analysis of private relayed transactions, along with the results obtained from our active experiments conducted on Bitcoin and Ethereum blockchains. The main objective of these experiments was to evaluate the lack of transparency in transaction contention and prioritization.
In summary, our findings indicate that private transactions and private relay networks are quite prevalent in both Ethereum and Bitcoin blockchains. Flashbots, in particular, is extensively used in Ethereum, accounting for a significant portion of 99.99% of the total Ethereum hash rate. It also enables arbitrageurs to exploit MEV opportunities by bundling their private transactions with public transactions like oracle updates or taking advantage of sandwich attacks. Similarly, in Bitcoin, miners offer transaction acceleration services, allowing users to privately offer a dark-fee to incentivize miners for a faster commit time. Through active experiments, we show that miners highly prioritize these transactions, on average including them in 1.8 blocks, with a range of 1 to 3 blocks. Worrisome, we uncover evidence of collusion among miners with a combined hash rate exceeding 50% to ensure the inclusion of these dark-fee transactions.
In the following chapter, we delve into the voting power distribution for amending smart contracts.
Author:
(1) Johnnatan Messias Peixoto Afonso
[14] The max-priority fee was introduced in EIP-1559 as the unique financial incentive miners get for including publicly announced transactions. The other fees are burned. [15] Based on the Bitcoin exchange rate on October 19th 2022, 1 BTC = 19,219.90 USD