Authors:
(1) Mahdi Goldani;
(2) Soraya Asadi Tirvan.
Table of Links
Abstract and Introduction
Methodology
Dataset
Similarity methods
Feature selection methods
Measure the performance of methods
Result
Discussion
Conclusion and References
Methodology
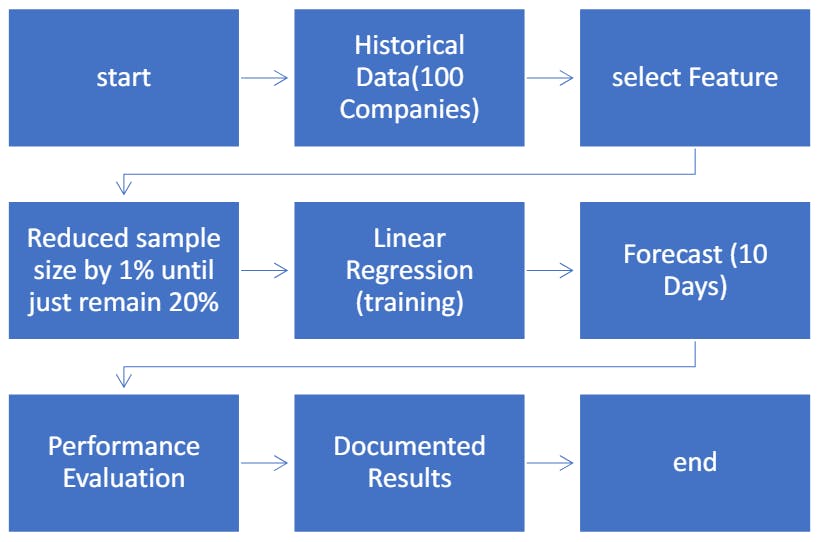
This section elaborates on the methodology adopted for this research work. The complete methodology is depicted in Fig. 1 and consists of the following steps.
• Historical finance datasets of the 100 biggest companies are collected
• In this step, appropriate features are selected using feature selection methods and similarity methods
• feature selection methods were used in 80 steps. Each step reduced the dataset size by 1% until just 20% of the primary dataset
• Linear regression is trained on selected features and forecast 10 days ahead of APPL close price.
• In the last step, Linear regression performance is evaluated through cross-validation techniques and results are documented


Dataset
Based on the aim of this paper, to examine the Density and performance of the feature selection methods and similarity methods during high and low sample sizes, the finance dataset was chosen. A large amount of financial data is a suitable feature to examine the performance of methods in large to small amounts of data. According to the Fortune Global 500 2023 rankings, the data set of this research was secondary data including open, low, high, and close prices and the volume of the 100 biggest companies by consolidated revenue. The target value of this dataset was Apple’s close price the prediction of the closing price of this variable is done in different data sizes and the best model was selected from among the datasets. The data were collected from the Yahoo Finesse site spanning from January 1, 2016, to January 28, 2024.
This research’s main approach is measuring feature selection algorithms’ sensitivity to sample size. For this purpose, the feature selection methods were used in 80 steps. Each step reduced the dataset size by 1% until just 20% of the primary dataset.
Similarity methods
As is clear in Table 1 each method of FS has some Limitations and weaknesses. Therefore, the time series similarity methods can be a good choice as feature selection methods. Measuring similarity in time series forms the basis for the clustering and classification of these data, and its task is to measure the distance between two-time series. The similarity in time series plays a vital role in analyzing temporal patterns. Firstly, the similarity between time series has been used as an absolute measure for statistical inference about the relationship between time series from different data sets [16]. In recent years, the increase in data collection has made it possible to create time series data. In the past few years, tasks such as regression, classification, clustering, and segmentation were employed for working with time series. In many cases, these tasks require defining a distance measurement that indicates the level of similarity between time series. Therefore, studying various methods for measuring the distance between time series appears essential and necessary. Among the different types of similarity measurement criteria for time series, they can be divided into three categories: step-by-step measures, distribution-based measures, and geometric methods. Table 2 describes both advantages and disadvantages of similarity methods.


This paper is available on arxiv under CC BY-SA 4.0 by Deed (Attribution-Sharealike 4.0 International) license.