Table of Links
Abstract and 1. Introduction
-
Methods
2.1 Tokenizer analysis
2.2 Indicators for detecting under-trained tokens and 2.3 Verification of candidate tokens
-
Results
3.1 Effectiveness of indicators and verification
3.2 Common observations
3.3 Model-specific observations
-
Closed-source models
-
Discussion, Acknowledgments, and References
A. Verification details
B. A short primer on UTF-8 encoding
C. Outputs for API-based verification
3 Results
In this section, we present a summary of our key findings regarding under-trained token detection. Given the model-specific nature and the extensive volume of results, we discuss some common findings as well as showcase some representative examples for particular models. Detailed reports covering all tested models and token types are available in our repository.
3.1 Effectiveness of indicators and verification
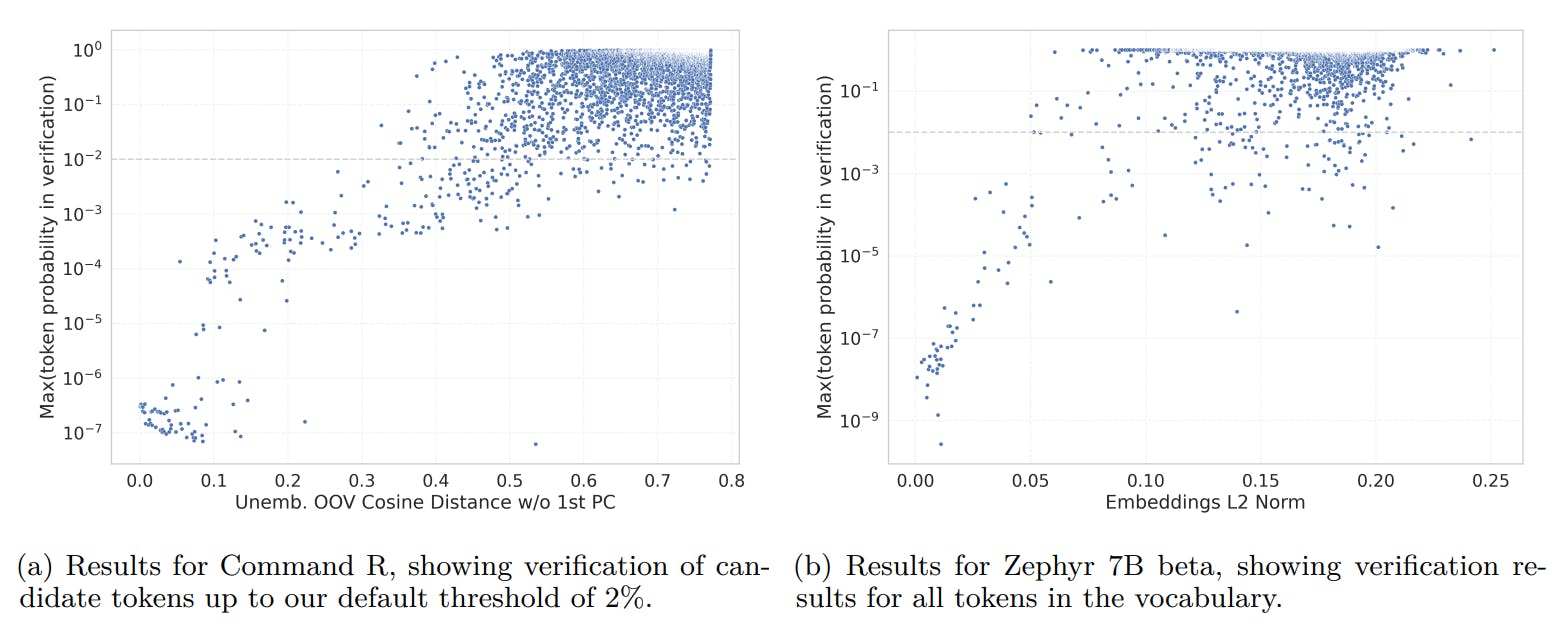
Figure 1 shows that despite their relative simplicity, our indicators are highly predictive of the maximal probability of token prediction. To quantify the number of tokens detected in verification compared to our candidate selection, we applied the verification step to all tokens for the Zephyr-beta model [12]. This resulted in 137 out of 31,747 verified tokens compared to 76 of 637 when testing only the top 2% candidate tokens.
Secondly, although training data statistics are rarely available, we were able to verify that our under-trained token indicators are closely related to the frequency tokens appear in training data for the OLMo v1.7 model [13]. Figure 2 shows a strong correlation for all proposed indicators, not only predicting under-trained tokens, but extending to the entire range of token frequencies.
Finally, Figure 3 shows additional examples of indicator metrics, showing clear peaks in the histogram near zero, and high correlation between alternative indicators in this region.


There are certain cases where the indicators we use are more predictive of a token’s tendency to induce unwanted output compared to our prompting techniques. With respect to verification, there are certain cases where the indicators we use offer a more reliable indication of a token’s tendency to induce unwanted output in typical prompting compared to our verification prompting techniques. These cases include input/output asymmetry, where tokens are solely present as inputs (e.g.,
Table 1 presents verification statistics and example verified tokens for the models evaluated. The number of verified under-trained tokens varies significantly across different model families and tokenizer vocabulary size, as well as depending on the number of unused special tokens a model’s tokenizer allows as plain-text input. The percentage of verified tokens typically ranges between 5–50% of tested candidate tokens, corresponding to 0.1–1% of the total vocabulary.